


Documentation menu
Getting started
Dashboard & analytics
- Dashboard at a glance
- Cost analysis
- Pipeline performance
- Optimization insights
- Knowledge Base
- Connect your AI agent
Managed runners
- Runners overview
- Run your first job
- Migrate from GitHub-hosted
- Latchkey CLI
- The Runners page
- Custom runners (AI Scan)
- Self-healing
- Runner image & software
- Provisioning & warm pools
- Limits & concurrency
Caching
Team & notifications
Billing & plans
Help
Troubleshooting
Symptom-by-symptom fixes: jobs stuck in queued, an empty dashboard, missing insights, blocked sign-in, and more.
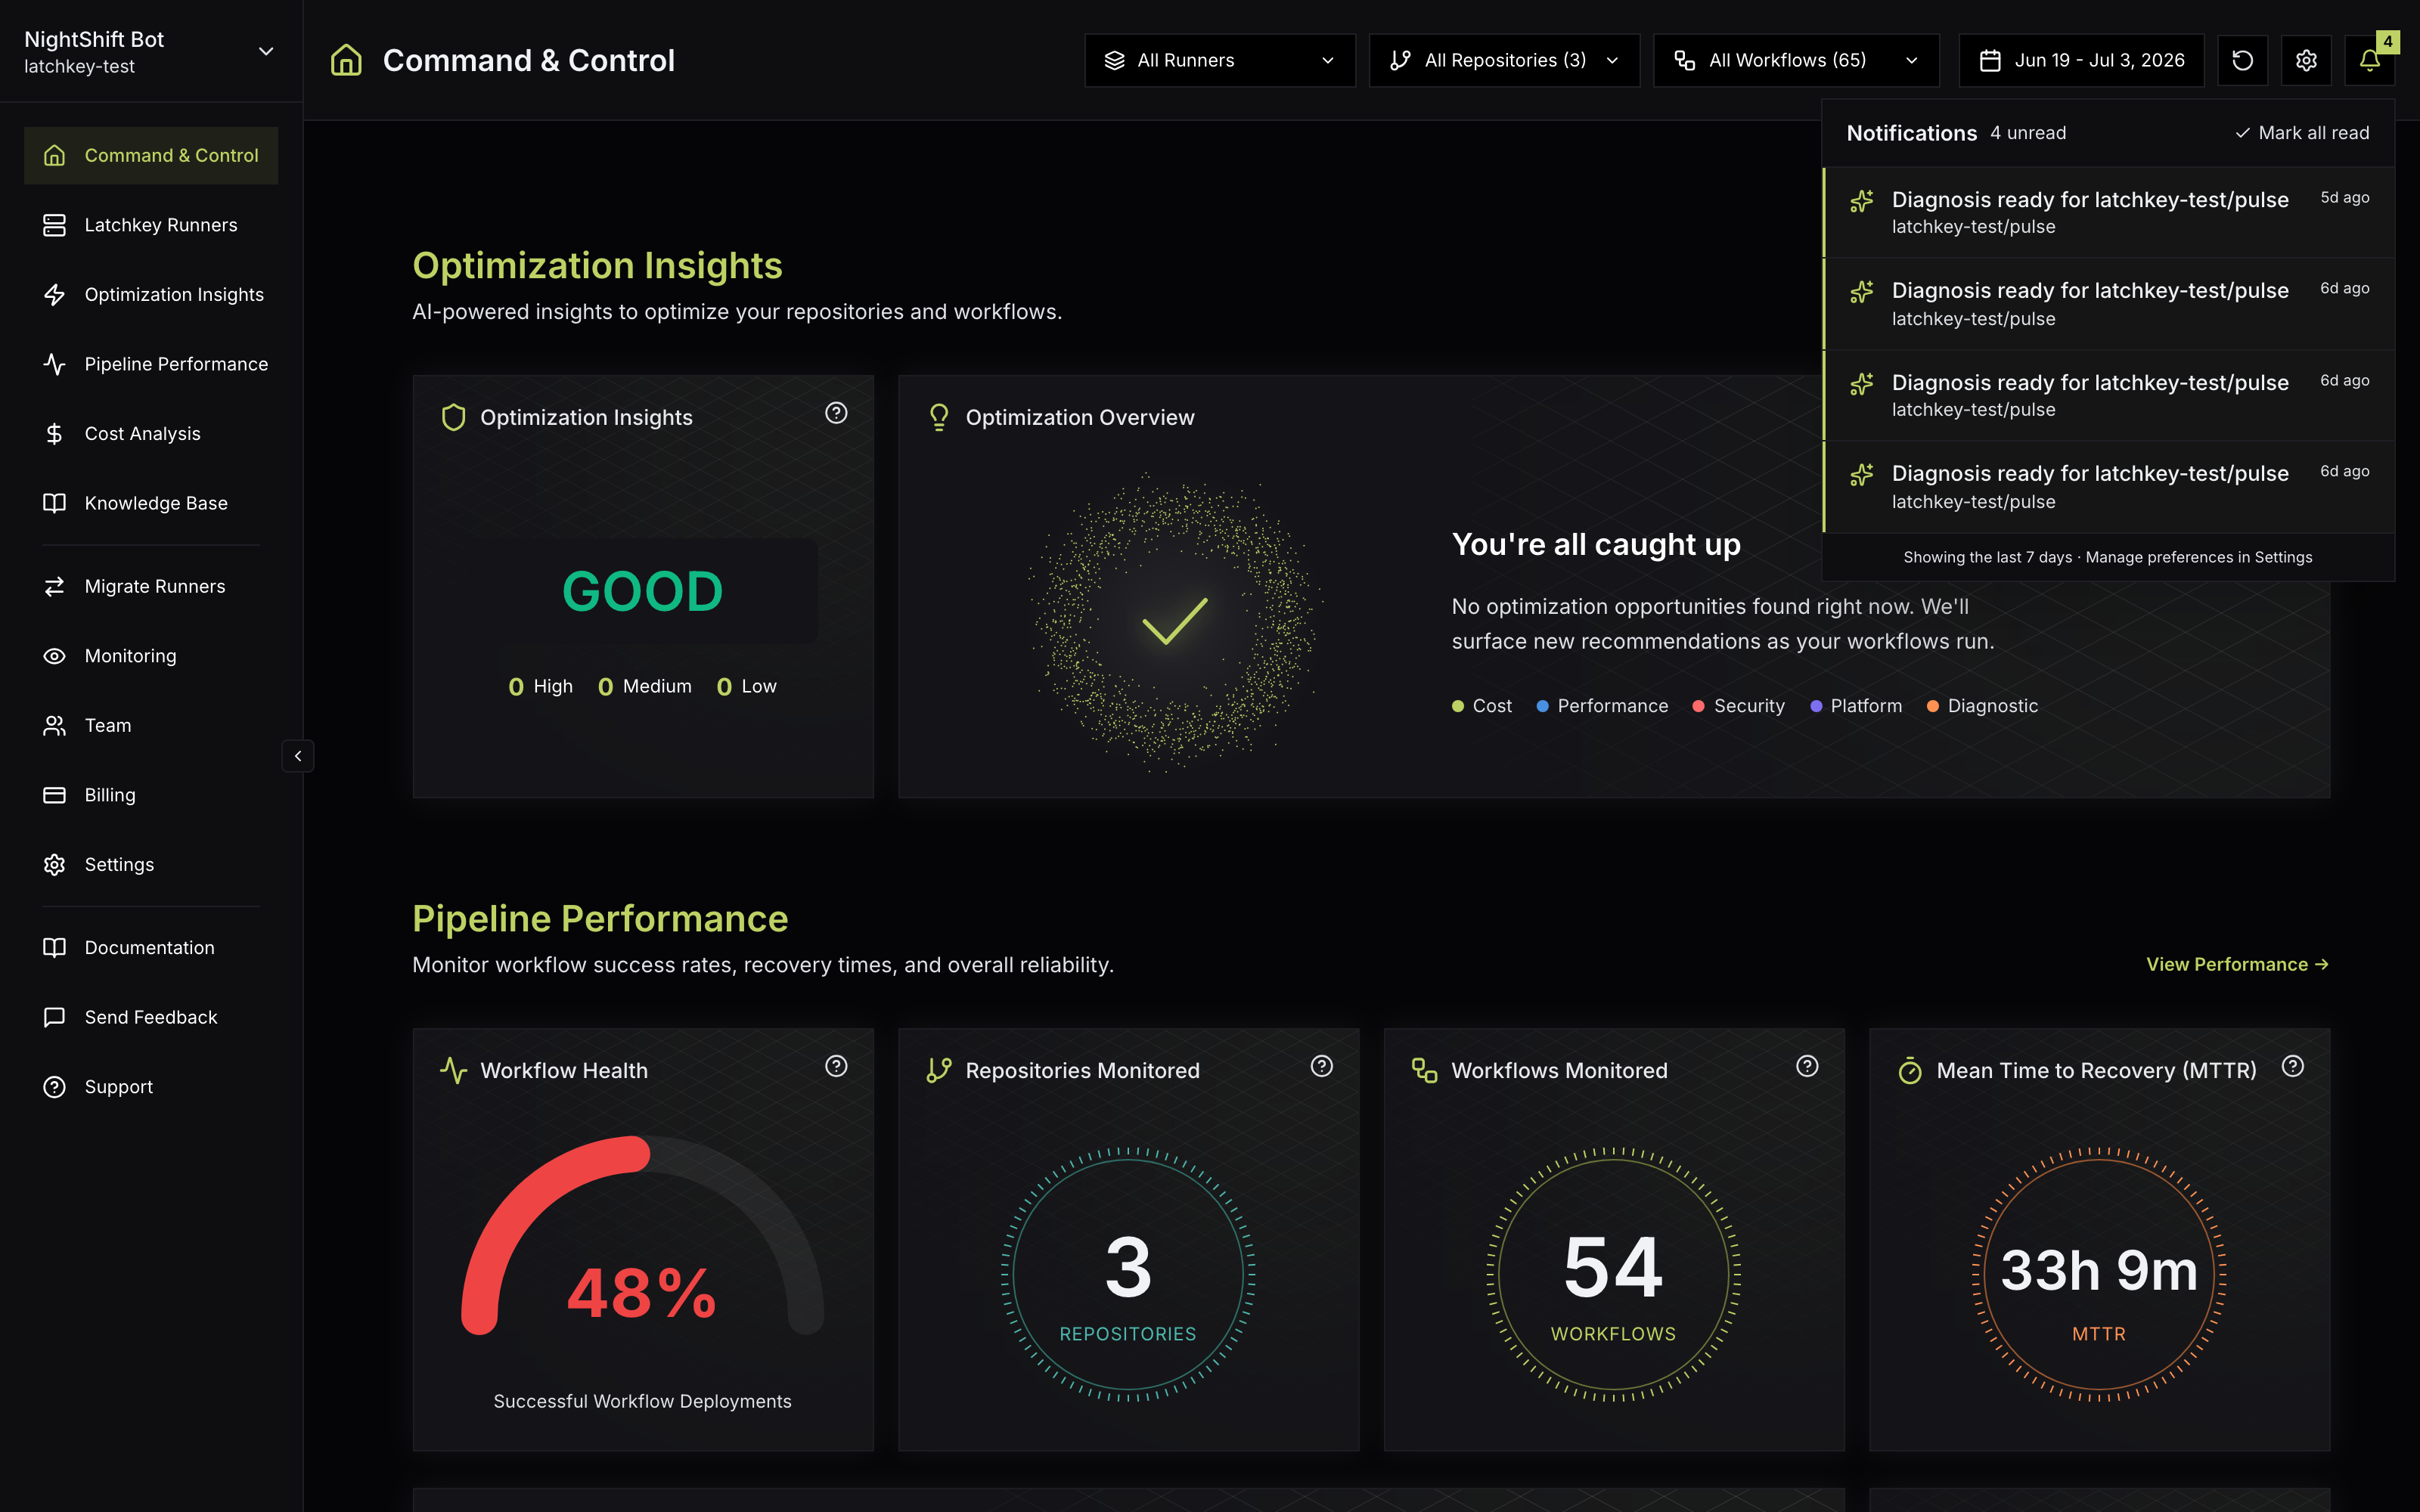
Each section below is one symptom, with its causes in the order they are most worth checking. Most problems announce themselves somewhere: a banner in the dashboard, a notification in the bell, or a status in a modal. This table tells you where to look first.
| Symptom | First check | Where |
|---|---|---|
| Job targeting a runner stays queued | The exact label string | The "Your runners" table on the Latchkey Runners page |
| Dashboard shows no data | A repository is selected | The filter bar at the top of every analytics page |
| No AI insights | The processing banner and the analysis branch | The Insights page and the Monitoring modal |
| Runner launches blocked | Trial, subscription, and free-tier state | The Billing page and the "Managed runner blocked" notification |
| Access suddenly blocked | Subscription status (trial ended, Past Due, Canceled) | The activation screen or the Billing page |
A job targeting a Latchkey runner stays queued#
This is the universal symptom for anything that stops a runner from being provisioned. GitHub keeps a job in "queued" until a runner with a matching label picks it up, and when Latchkey blocks or cannot route a launch there is no error on GitHub's side; the job just waits. That means the diagnosis always happens on the Latchkey side. For how provisioning decides between a warm pickup and a cold start when nothing is wrong, see How provisioning works. Triage in this order:
Rule out a label typo
The label must be exactly latchkey-small, latchkey-medium, latchkey-large, latchkey-xlarge, or one of your custom labels. How to confirm: the "Your runners" table on the Latchkey Runners page shows the exact strings; compare against your workflow file character by character (a stray space or a wrong hyphen is enough to miss). Both label forms route identically, so runs-on: latchkey-small and runs-on: [self-hosted, latchkey-small] behave the same; the array form is not the problem.
Confirm the repository is monitored
Managed runners only serve monitored repositories, so a job from an unmonitored repo waits forever. How to confirm: open the Monitoring modal from the dashboard sidebar (owners and admins) and check the repository's toggle. If you are at your plan's repository limit, further toggles are blocked and the modal points you to upgrade; see Managing repositories.
Check that the runner configuration is enabled
A disabled configuration stops accepting new jobs, and jobs targeting its label queue. How to confirm: the configuration's row on the Runners page shows its enable/disable state, for the presets and for custom runners alike.
Check trial, subscription, and free-tier state
An expired trial, a lapsed (past due or canceled) subscription, or an exhausted free tier on a card-less trial all block new runner launches. How to confirm: look for a "Managed runner blocked" notification in the notification bell, then open the Billing page: the trial notice and the free-tier meter, or the activation screen a past due or canceled subscription lands on, tell you which case you are in. Subscribing, or fixing the payment method in the Stripe portal, restores launches immediately; see Runner usage and free minutes.
Check whether a custom image is still building
Jobs targeting a new custom configuration wait until its image finishes building. How to confirm: the configuration row on the Runners page shows image build status, and you are notified when the runner is ready ("AI scan runner is ready") or if the build failed. See Custom runners.
Check the concurrency ceiling
If your workspace's concurrent-job limit is already in use (every workspace starts at 40, the Launch number; idle warm and parked runners hold no slot), further jobs wait for a slot. How to confirm: this shows up when many workflows fire at once across your repositories, and the queued jobs start on their own as running jobs finish. Higher limits are available; see Limits and concurrency.
The dashboard shows no data#
An empty dashboard almost always means filters or timing, not lost data. Check in this order:
- No repository selected. The filter bar drives every analytics page, and pages prompt you to pick a repository if nothing is selected. How to confirm: check the Repository selector in the filter bar at the top; if the filters are in a confusing state, Reset filters returns them to defaults.
- Backfill still running. A newly enabled repository imports recent history first, and most teams see data within a few minutes. How to confirm: the backfill progress banner shows in the dashboard until the import completes; wait for it to clear before judging the pages.
- No runs in the window. Backfill covers completed runs from the last 30 days, and the date-range filter must overlap actual activity. How to confirm: check the repository's recent workflow runs on GitHub; if the last run predates the backfill window, the pages stay empty until new runs happen. Widen the date-range picker before concluding data is missing.
- App installed on the wrong org. If the GitHub App is not installed on the organization that owns the repositories, no events arrive at all. How to confirm: on GitHub, open the organization's Settings, then GitHub Apps, and check that Latchkey is listed there. Fix by installing on the right organization; see Install the GitHub App.
No AI insights are appearing#
Insight generation is automatic and event-driven; there is no button to press. The agent runs after the initial backfill of a newly monitored repository, when a workflow file changes on the analysis branch, on repeated consecutive failures, on a cost spike, and on performance degradation. So "no insights" usually means the trigger has not fired yet, or the agent is looking at a different branch than you are:
- Analysis still running or not yet triggered. Insights generate automatically after backfill completes. How to confirm: the Insights page shows a processing banner while the agent runs; give a new repository a few minutes.
- Wrong analysis branch. Analysis follows the analysis branch chosen in the Monitoring modal (the repository default branch by default); workflows that exist only on other branches are not analyzed. How to confirm: open the Monitoring modal and check the branch picker next to the repository. See Managing repositories.
- Legitimately little to say. Small or rarely run workflows can produce few recommendations; that is a finding, not a failure. Editing a workflow file retriggers analysis, so check back after your next workflow change.
Applying recommendations failed or dropped changes#
Recommendations are generated against the workflow file as it existed at analysis time. If the file has changed since (your edits, or a previously merged Latchkey PR), some recommendations no longer apply cleanly:
- Latchkey opens the PR with what still fits and lists the recommendations that need manual placement. The PR arrives titled "Latchkey insight: <what it does>" (for example "Latchkey insight: pin GitHub Actions to commit SHAs") on a
latchkey/insight-<detector>-<hex>branch, and a success banner links you straight to it. - If all selected recommendations were dropped, do not retry the stale set. Editing the workflow triggers a fresh analysis; wait for it to finish (the processing banner on the Insights page clears), then apply from the fresh set. See Optimization insights.
A payment failed and access is blocked#
A Past Due status means a payment failed: dashboard and API access are blocked and runner launches stop until the payment method is fixed in the Stripe portal, where payment methods, invoices (with PDFs), and subscription details are managed. If the subscription was Canceled instead, access is blocked but billing remains reachable so you can re-subscribe. Your data is retained in both cases. Statuses and their effects are listed in Managing your subscription.
I cannot use the dashboard on my phone#
That is by design for now: the dashboard is desktop-only, and mobile and tablet browsers see a blocking notice after sign-in. Notifications by email, Slack, and push, plus the weekly digest, keep you covered away from your desk.
I installed the app on my personal account#
Personal accounts are not supported. Latchkey automatically removed that installation, so there is nothing to clean up; retry onboarding and pick a GitHub organization. If you only have a personal account, create an organization first (free on GitHub) and move your repositories into it. Details in Install the GitHub App.
My trial ended and everything is blocked#
Your data is intact; the block is on access, not on storage. The dashboard is replaced by a "Your free trial has ended" screen, API access is blocked with the same message, and managed runner launches are blocked (jobs targeting latchkey-* labels stay queued on GitHub rather than erroring). Subscribe from the activation screen (or the Billing page if you can reach it) and access, including runner launches, is restored immediately. The trial runs once per workspace, so subscribing or changing plans does not restart it. See Plans and the free trial.
Still stuck?#
The FAQ covers the quick answers. For anything else, head to Support or use Send Feedback in the dashboard sidebar; both reach the team directly.
My job is stuck in queued. What do I check first?
Six things, in this order: the runner label, whether the repository is monitored, the runner configuration, billing state, an image build still in progress, and the concurrency ceiling. Each has an explicit tell, so working down the list finds it faster than guessing.
My dashboard is empty. Where did my data go?
Almost always the filter bar or backfill timing rather than lost data. Widen the date range and clear repository and workflow filters first; if the workspace is new, the backfill of the last 30 days may still be importing.
I installed the GitHub App on my personal account. What now?
Latchkey requires an organization, so a personal installation cannot be used. Create a free organization, transfer the repository into it, and install the app there; the trial and any collected data follow the workspace, not the failed install.